When we talk about investing, two terms often pop up fundamental analysis and technical analysis. These are the tools that investors use to study stocks, cryptocurrencies, or other financial assets before making decisions. If you’ve ever wondered how people decide whether to buy or sell an asset, these two methods play a big role.
In this guide, we’ll break down what fundamental and technical analysis mean in simple terms and how they help investors make smarter choices. By the end, you’ll have a clear idea of how these methods work, even if you’re completely new to the world of investing!

What Is Fundamental Analysis?
Fundamental analysis focuses on the actual value of a company or asset. It’s like looking under the hood of a car before buying.. Investors who use fundamental analysis study things like:
Company profits (how much money the company makes)
Revenue (total sales the company generates)
Assets (things owned by the company have value)
Debts (how much money the company owes)
Management (how well the company is run)
This analysis helps investors decide if a stock (or cryptocurrency) is undervalued (priced lower than it should be) or overvalued (priced higher than it should be). Investors usually want to buy undervalued stocks because they believe the price will eventually go up.
Key Metrics in Fundamental Analysis
There are several important tools and metrics that investors look at when conducting fundamental analysis:
Earnings Per Share (EPS): This shows how much profit a company makes for each share of stock. These types of apps usually mean that the company is more profitable.
Price-to-Earnings (P/E) Ratio: This compares a company’s current stock price to its earnings. A lower P/E ratio might mean the stock is undervalued, while a higher P/E ratio could suggest the stock is overvalued.
Return on Equity (ROE): This tells investors how efficiently a company is using its money to generate profits. A higher ROE is a good sign of a strong business.
Debt-to-Equity (D/E) Ratio: This shows how much debt a company has compared to its equity (ownership value). A lower D/E ratio indicates a more financially stable company.
Practical Example of Fundamental Analysis
Imagine you’re thinking about investing in a famous tech company, let’s call it TechCorp. To do a fundamental analysis, you would start by looking at TechCorp’s recent financial statements. You check that the company has been consistently growing its profits (EPS is increasing), its debts are manageable (low D/E ratio), and its P/E ratio suggests the stock is undervalued compared to competitors.
After reviewing all this data, you decide that TechCorp is a good investment because its fundamentals are strong.
What Is Technical Analysis?
Technical analysis is different from fundamental analysis. Instead of focusing on the actual value of a company, technical analysis looks at price movements and trading volume to predict future trends. It’s like studying patterns in the sand to see where the waves are heading.
Technical analysts use charts and historical data to understand how the price of a stock or cryptocurrency has moved in the past and how it might behave in the future. They believe that all the important information is already reflected in the price.
Key Tools in Technical Analysis
Here are a few common tools that technical analysts use:
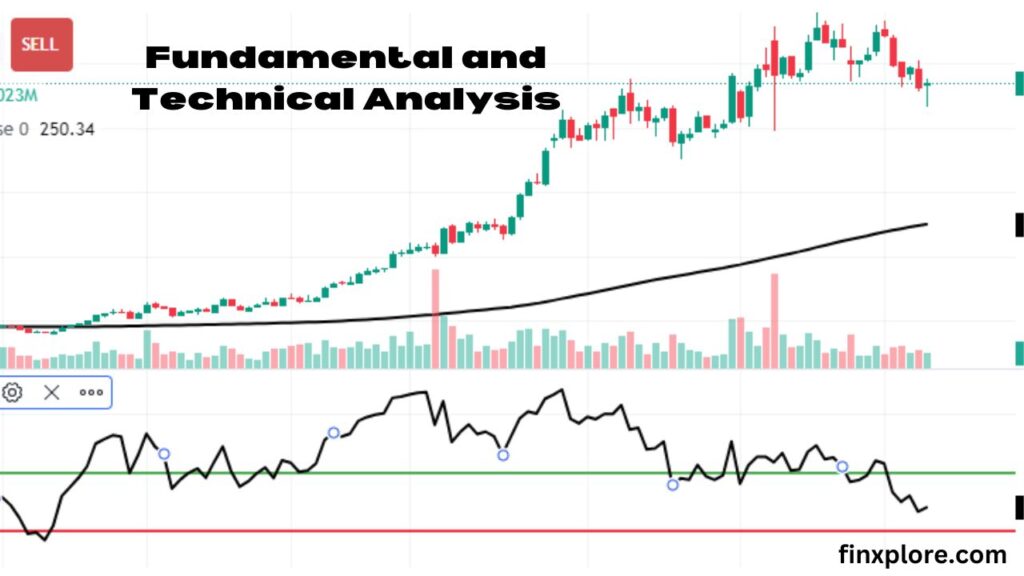
Charts: Price charts are the basis of technical analysis. There are various types of charts, but the most common one is the candlestick chart, which shows the opening, closing, high, and low prices for a specific period.
Moving Averages (MA): A moving average is the average price of an asset over a set number of days. For example, a 50-day moving average shows the average price of the stock over the last 50 days. If the price is above the moving average, it could indicate an upward trend.
Support and Resistance Levels: These are price points where the stock or asset typically bounces off (support) or stops rising (resistance). Investors use these levels to predict price movements.
Relative Strength Index (RSI): This is a momentum indicator that tells whether a stock is overbought or oversold. If RSI is above 70, the stock might be overbought (too expensive). If it’s below 30, the stock could be oversold (too cheap).
Practical Example of Technical Analysis
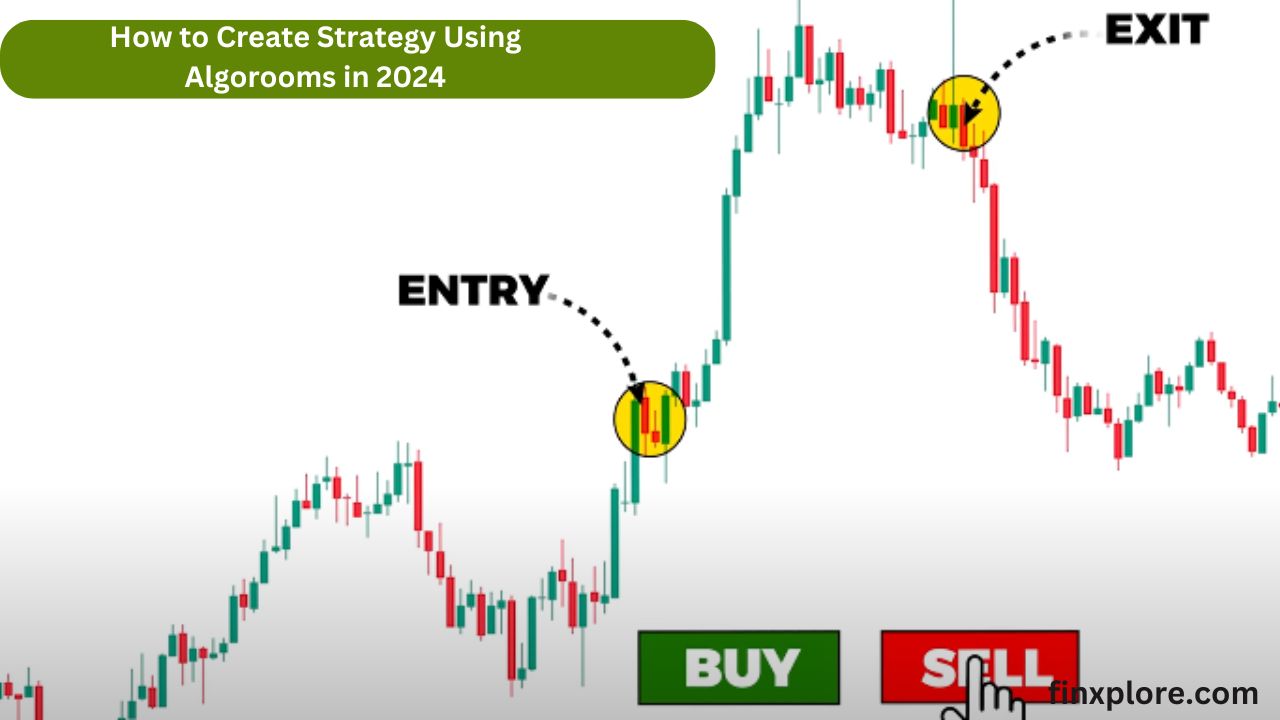
Let’s say you’re looking at a stock called BlueWave Inc.. By studying its price chart, you notice that every time the price hits $50, it tends to rise. This $50 mark is known as a support level. Based on this, you might decide to buy the stock when it’s around $50, expecting it to go up again.
Fundamental vs. Technical Analysis: What’s the Difference?
Now that you know what both types of analysis are, let’s compare them side by side:
| Fundamental Analysis | Technical Analysis |
| Focuses on a company’s financial health and value | Focuses on price movements and market trends |
| Long-term investment strategy | Short-term trading strategy |
| Uses financial statements, earnings, and ratios | Uses charts, moving averages, and indicators |
| Best for investors looking for undervalued stocks | Best for traders looking to profit from price swings |
| Example: Buying a stock based on company growth | Example: Buying a stock based on a price pattern |
Which One Should You Use?
Truth has no authority and there is no reaction to what they say. Some investors prefer fundamental analysis because they like to look at the company’s overall value and hold stocks for a long time. On the other hand, technical analysis is popular among traders who want to make quick profits from short-term price movements.
Many investors even combine both strategies! They might use fundamental analysis to find a good company to invest in, then apply technical analysis to figure out the best time to buy or sell.
Combining Fundamental and Technical Analysis
Imagine you’re considering investing in GreenTech, a renewable energy company. You’ve done your fundamental analysis and found that the company has strong earnings, low debt, and is growing quickly. You decide it’s a good company to invest in for the long term.
But before jumping in, you also look at the technical analysis. You notice that GreenTech’s stock has been hovering around a key resistance level at $70. Based on the chart patterns, you decide to wait until the price breaks above $70 before buying. This way, you’re using both fundamental and technical analysis to make a more informed decision.
Why Understanding These Analyses is Important
Whether you’re investing in the stock market, cryptocurrency, or any other asset, understanding these two methods is essential. Here’s why:
Informed Decisions: You’ll be able to make smarter investment decisions based on real data, not just guesses.
Risk Management: Knowing when to buy or sell can help you reduce your risk of losses.
Greater Profits: By analyzing companies and price patterns, you can potentially increase your returns.
Final Thoughts
Both fundamental analysis and technical analysis have their own strengths, and knowing how to use them can give you an edge in investing. Whether you’re just getting started or looking to improve your strategy, these methods will help you make more informed choices.
Remember, successful investors often combine both approaches, using fundamental analysis to find valuable assets and technical analysis to decide when to buy or sell.
By learning these techniques, you’ll be better prepared to navigate the world of investing with confidence. Happy investing!


